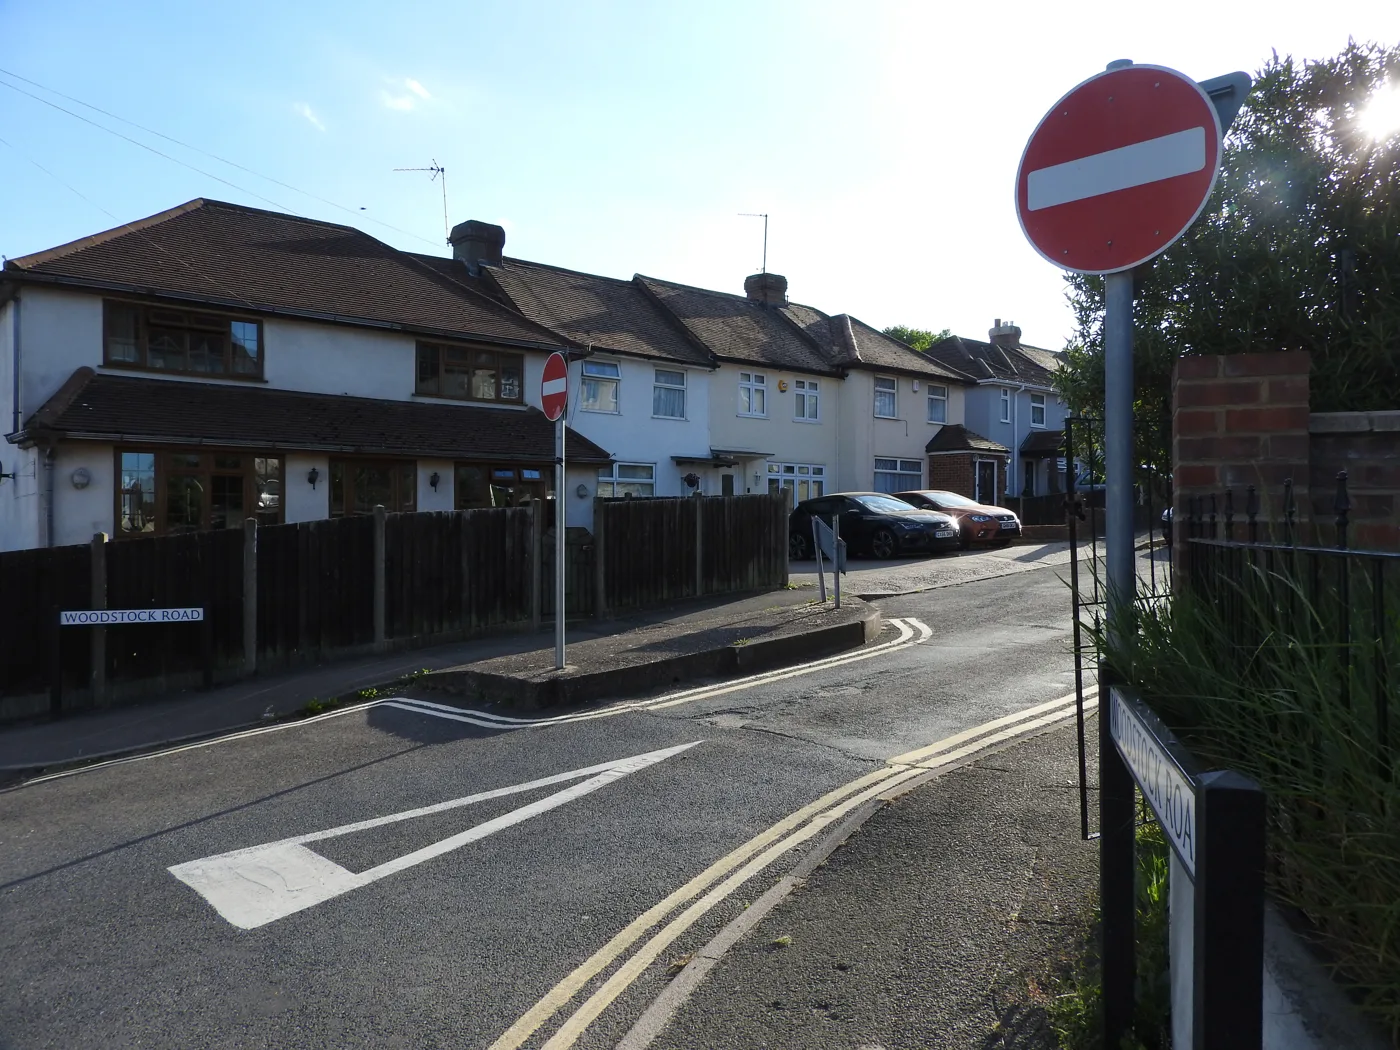

The average Medway home hit £296,182 in June, up 1.1% in a year, but still £6,055 under its January 2023 high. Flats are 7.1% below theirs.
The average Medway home sold for £296,182 in June 2026, up £3,259, or 1.1%, on a year earlier. That comes from the UK House Price Index published by HM Land Registry on 19 August 2026.
It is a small rise. It is also a reversal.
Last month said Medway was falling. This month says it is not
A month ago the same index had Medway going backwards while the rest of Kent went forwards. The first release of the May figure, published on 31 July, put the Medway average at £292,653 and down 0.4% on the year (UK House Price Index for May 2026).
That figure has now been restated. In the June release, May reads £293,961 and 0.0% on the year. The revision moved the average up by £1,308 and took the annual fall away entirely.
This is normal, not a correction of an error. The index is built from sales as they complete and register, so the most recent months are always provisional and always move. It is worth remembering the next time a single month’s number is used to describe a market.
Medway against the rest of Kent
Twelve of Kent’s thirteen local authority areas rose over the year to June. Only Tunbridge Wells fell. Medway’s 1.1% puts it ninth of the thirteen, growing at about half the county rate of 2.1%.
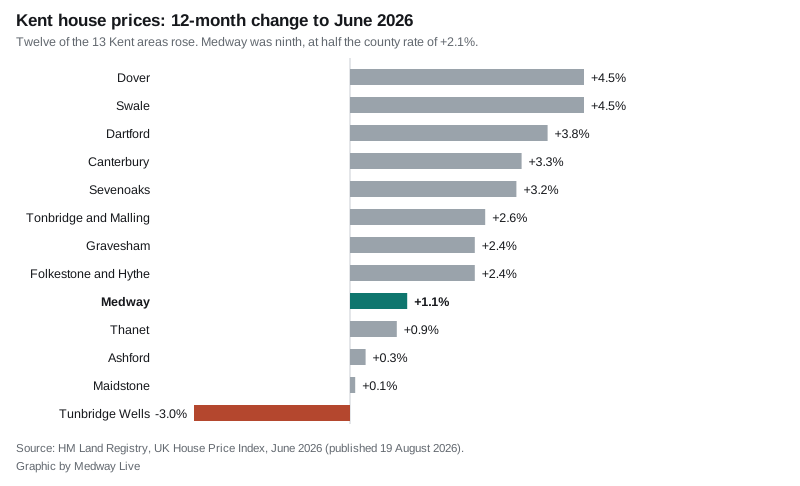
The full county picture, twelve-month change to June 2026, with the June average alongside:
| Area | Average price | 12-month change |
|---|---|---|
| Dover | £276,234 | +4.5% |
| Swale | £298,394 | +4.5% |
| Dartford | £351,594 | +3.8% |
| Canterbury | £338,030 | +3.3% |
| Sevenoaks | £543,081 | +3.2% |
| Tonbridge and Malling | £405,932 | +2.6% |
| Gravesham | £345,369 | +2.4% |
| Folkestone and Hythe | £304,717 | +2.4% |
| Medway | £296,182 | +1.1% |
| Thanet | £268,760 | +0.9% |
| Ashford | £344,332 | +0.3% |
| Maidstone | £352,191 | +0.1% |
| Tunbridge Wells | £445,133 | -3.0% |
Two things stand out from that list for anyone buying here.
Medway is still the second cheapest place to buy a home in Kent, behind Thanet. A Medway average is £49,187 below Gravesham next door, £56,009 below Maidstone and £246,899 below Sevenoaks.
It is now a shade above the England average. England came in at £293,262 in June, so the typical Medway home costs about £2,900 more than the typical English one. Against the South East as a whole, at £380,380, Medway is £84,198 cheaper.
Nearly four years on, and still short of the peak
The strongest number in this release is one the headline does not carry.
Medway’s average price peaked in January 2023 at £302,237. June 2026 is £6,055 below that, or 2.0% down, 41 months later. In cash terms the Medway market has gone nowhere for three and a half years, and once inflation is taken into account it has gone backwards.
The pattern within that is not even. Splitting June’s average by property type:
- Detached: £531,901, up 0.1% on the year
- Semi-detached: £351,457, up 1.7%
- Terraced: £273,509, up 1.8%
- Flat: £167,976, down 1.5%
Flats are the outlier, and by a distance. They peaked in the same month as everything else, January 2023, at £180,764. They are now £12,788 lower, a fall of 7.1%. Terraces and semis, the bulk of Medway’s housing stock, are the two types carrying what growth there is.
A first-time buyer in Medway paid an average of £268,519 in June, up 1.4% on the year. Someone already on the ladder and moving paid £345,668, up 0.8%. The £77,000 gap between those two figures is, in practice, the cost of the step from a first flat or terrace to a family house.
An important caveat about the word “average”
The UK House Price Index reports a mean average, not a median. It is the total value of sales divided by the number of them, so a handful of expensive detached sales in Hempstead or on the Hoo Peninsula pulls the Medway figure up in a way a median would not.
It also covers the whole unitary authority, from Strood and the Hoo villages to Rainham and Walderslade. There is no single Medway market, and the £296,182 figure should be read as a direction of travel rather than a valuation of any particular street.
What it means for you
If you are selling. The market is flat rather than rising. Pricing against what your street actually sold for this year matters more than what it fetched in 2022, because the borough average has not recovered its January 2023 level.
If you are buying your first home. Flats are the one part of the Medway market that is still cheaper than a year ago, and 7.1% cheaper than at the 2023 peak. If a flat suits you, the numbers are moving your way; if you want a terrace, they are not.
If you are trying to work out what a home is worth. Use completed sale prices, not asking prices. The Land Registry’s price paid data shows what individual homes on a given street actually sold for. Our Medway house prices page sets the same figures out in more detail, including how Rochester, Gillingham and Chatham compare.
If you are budgeting for a move. Remember the council tax band moves with the house, not the price. Our Medway council tax bands page has this year’s charges.
The July 2026 index is published at 9.30am on Wednesday 16 September, and it will restate June, as June restated May.
Sources
- HM Land Registry, UK House Price Index, Medway, June 2026, published 19 August 2026
- HM Land Registry, UK HPI full file for June 2026, the source of the Kent comparison table, the property-type splits and the January 2023 peak figures
- HM Land Registry, UK House Price Index reports for the release calendar and the mean-average methodology
All figures are from the June 2026 UK House Price Index and are provisional; the Land Registry revises recent months as more sales complete. Published 22 August 2026.
Have your say