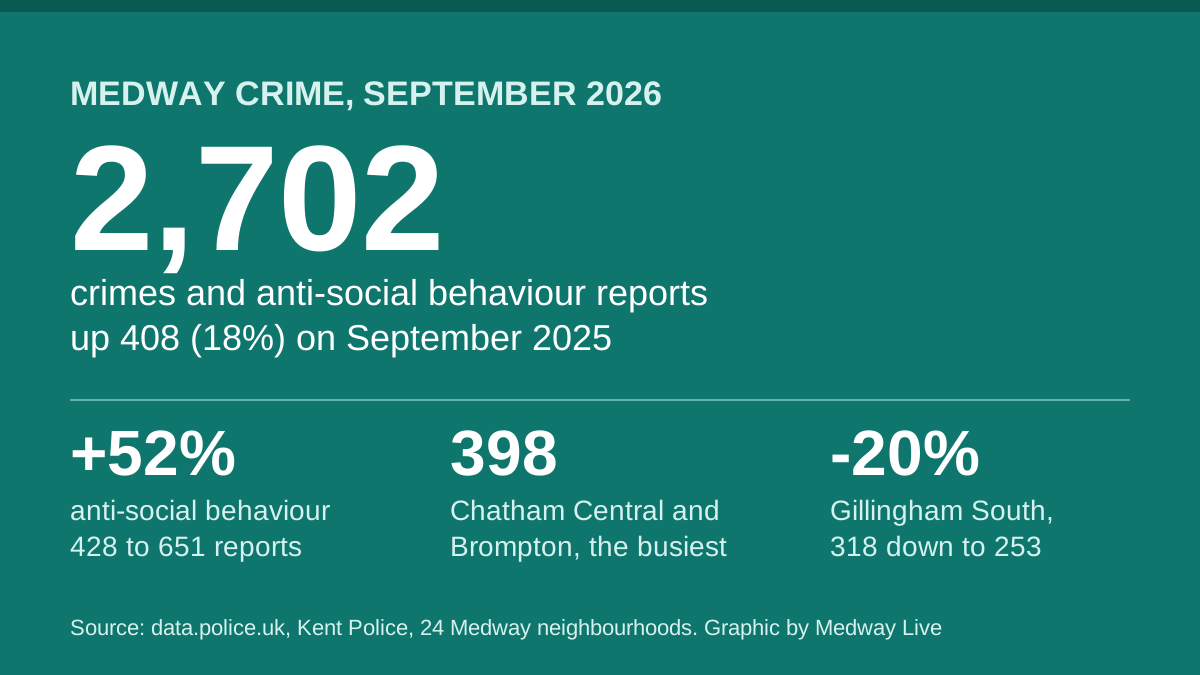

Medway recorded 2,702 crimes and anti-social behaviour reports in September 2026, up 18% on a year ago. Anti-social behaviour rose 52%, while Gillingham South fell by a fifth.
Police recorded 2,702 crimes and reports of anti-social behaviour across Medway in September 2026. That is 408 more than in September 2025, a rise of 18%.
More than half of that rise was anti-social behaviour. Reports went up from 428 to 651, an increase of 52%.
The figures come from police.uk, which has now published September’s street-level data. We counted every record inside each of the 24 Kent Police neighbourhoods that make up Medway, using the force’s own boundaries. We compare September with September because crime follows the seasons, so a month-on-month comparison mostly measures the weather.
Compared with August, the total fell by 134, from 2,836. August’s figure is unchanged since we reported it last month.
What went up and what went down
| Type | September 2025 | September 2026 | Change |
|---|---|---|---|
| Violence and sexual offences | 888 | 955 | up 67 (8%) |
| Anti-social behaviour | 428 | 651 | up 223 (52%) |
| Criminal damage and arson | 175 | 201 | up 26 (15%) |
| Other theft | 165 | 190 | up 25 (15%) |
| Shoplifting | 154 | 184 | up 30 (19%) |
| Public order | 101 | 123 | up 22 (22%) |
| Vehicle crime | 102 | 100 | down 2 |
| Drugs | 99 | 76 | down 23 (23%) |
| Other crime | 62 | 72 | up 10 |
| Burglary | 41 | 49 | up 8 |
| Possession of weapons | 31 | 35 | up 4 |
| Robbery | 19 | 29 | up 10 |
| Bicycle theft | 21 | 22 | up 1 |
| Theft from the person | 8 | 15 | up 7 |
| Total | 2,294 | 2,702 | up 408 (18%) |
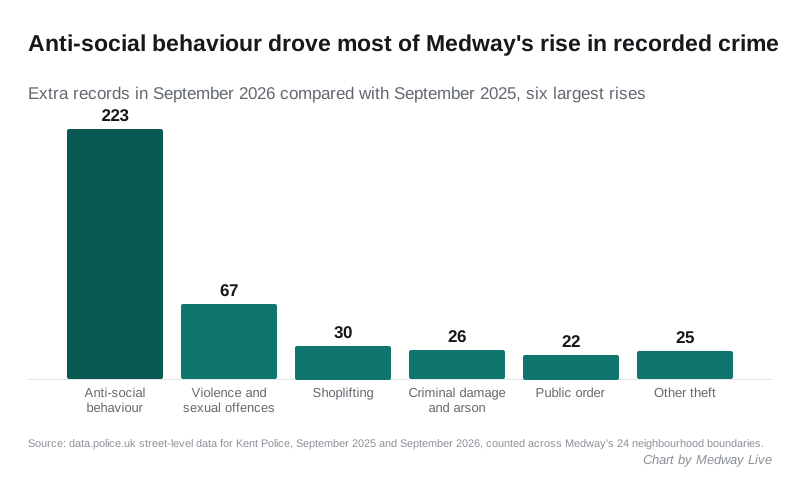
Violence and sexual offences are still the largest category, at about a third of everything recorded.
Recorded drug offences fell for the second month running. Most drug offences are logged when officers find drugs, often in a stop and search. So the number follows police activity as closely as it follows drug use.
Where in Medway
Chatham Central and Brompton recorded the most again: 398 records, up from 320 a year earlier. That included:
- 146 violent and sexual offences, up from 117
- 101 reports of anti-social behaviour, up from 67
- 22 shoplifting offences, up from 19
Gillingham South went the other way for the second month. It recorded 253, down from 318, a fall of 20%. Violent crime there fell from 126 to 93, and shoplifting from 39 to 12.
The next busiest were:
- Fort Pitt: 201, up from 149
- Gillingham North: 199, up from 145
- Rochester West and Borstal: 167, up from 146
- Strood North and Frindsbury: 149, up from 116
The biggest proportional rise was in Twydall, which more than doubled from 43 to 96. Violent and sexual offences there went from 22 to 38, and anti-social behaviour from 7 to 26.
The quietest neighbourhoods were All Saints with 20 records, St Mary’s Island with 23 and Hempstead and Wigmore with 27.
These are counts, not rates. Police.uk does not publish a population for each neighbourhood. A busy town centre with few residents will always look worse than a large housing estate.
Anti-social behaviour: Strood again
Reports of anti-social behaviour rose in 21 of Medway’s 24 neighbourhoods. The largest increases were:
- Chatham Central and Brompton: 101, up from 67
- Strood North and Frindsbury: 58, up from 26
- Twydall: 26, up from 7
- Fort Pitt: 35, up from 17
- Rainham North: 43, up from 26
- Lordswood and Walderslade: 31, up from 14
Strood North and Frindsbury also had the sharpest rise in August, when it went from 36 to 77. In September, as in August, most of its reports were in the shops. Police.uk placed 19 “on or near Shopping Area” and 12 “on or near Supermarket”.
Shoplifting: the same spot in Fort Pitt
Fort Pitt again had the most shoplifting in Medway: 39 offences, up from 24 a year earlier.
Of those 39, police.uk recorded 29 “on or near Petrol Station”, the same map point that held 44 of Fort Pitt’s shoplifting offences in August. Police.uk moves every crime to the nearest of a fixed set of anonymous points to protect victims’ privacy. So the label marks a location, not a particular business, and we cannot say which shop the thefts came from.
What it means for you
You can see the crimes recorded near your own street, month by month, on the police.uk crime map. Enter a postcode to find your Kent Police neighbourhood team, its priorities and its next public meetings.
To report anti-social behaviour or a crime that is not an emergency, go to Kent Police’s website or call 101. Always call 999 if a crime is happening now or someone is in danger.
October’s figures are due on police.uk in early December.
How we counted
Kent Police divides Medway into 24 neighbourhoods. We downloaded each neighbourhood’s boundary from the police.uk API. Then we counted every crime and anti-social behaviour record inside it, for September 2026, August 2026 and September 2025. No record was counted twice. The September 2025 figures use today’s boundaries, so the comparison is like for like.
Police.uk figures are what officers record, and the force can reclassify a crime after it is first logged. They can change slightly when police.uk republishes a month.
Sources
- data.police.uk, street-level crimes for Kent Police, September 2026, August 2026 and September 2025, queried by neighbourhood boundary on 7 November 2026
- Kent Police neighbourhoods on the police.uk API, Medway’s 24 XA neighbourhoods
Have your say