
Medway's claimant count rose to 7,670 in July, 4.2% of working-age residents and above England's 4.0%. Ward rates run from 1.5% in Hempstead to 7.7% in Chatham.
Medway had 7,670 people on the claimant count in July 2026, according to figures the Office for National Statistics released on 18 August. That is 4.2% of residents aged 16 to 64, and 335 more people than in July last year, a rise of 4.6%.
The number matters less than where it sits. Medway’s rate is now above England’s, well above the rest of the South East, and it has not moved off 4.2% since February.
Medway against its neighbours
All figures are for July 2026, from the same ONS dataset.
| Area | Claimants | Rate |
|---|---|---|
| Medway | 7,670 | 4.2% |
| England | 1,482,670 | 4.0% |
| Kent county | 33,515 | 3.4% |
| South East | 185,120 | 3.1% |
Medway sits above the England average and a third higher than the South East as a whole. The gap with the rest of Kent is the one worth watching: Kent county council’s area, which excludes Medway, is on 3.4%.
Every one of those areas rose over the year, so this is not a Medway-only story. England was up 16,370 claimants, Kent up 1,755 and the South East up 5,970. But England’s rate was unchanged at 4.0% while Medway’s went from 4.0% to 4.2%.
The rate stepped up in February and stayed there
The more telling pattern is in the monthly series. In the 18 months to January 2026, Medway’s claimant rate was 4.0% or 4.1% in every month but one, touching 4.2% only in March 2025. In February 2026 it moved to 4.2% and stayed there. It has been 4.2% in all six months since: February, March, April, May, June and July.
The headcount tells the same story. Medway’s count has not been below 7,600 since January. It peaked at 7,755 in March, the highest figure in the past two years.
One caution on the monthly numbers. This series is not seasonally adjusted, so month-to-month moves partly reflect the time of year rather than the underlying picture. That is why the comparison worth making is with the same month a year earlier, and on that basis Medway is up 335.
The five-fold gap between Medway wards
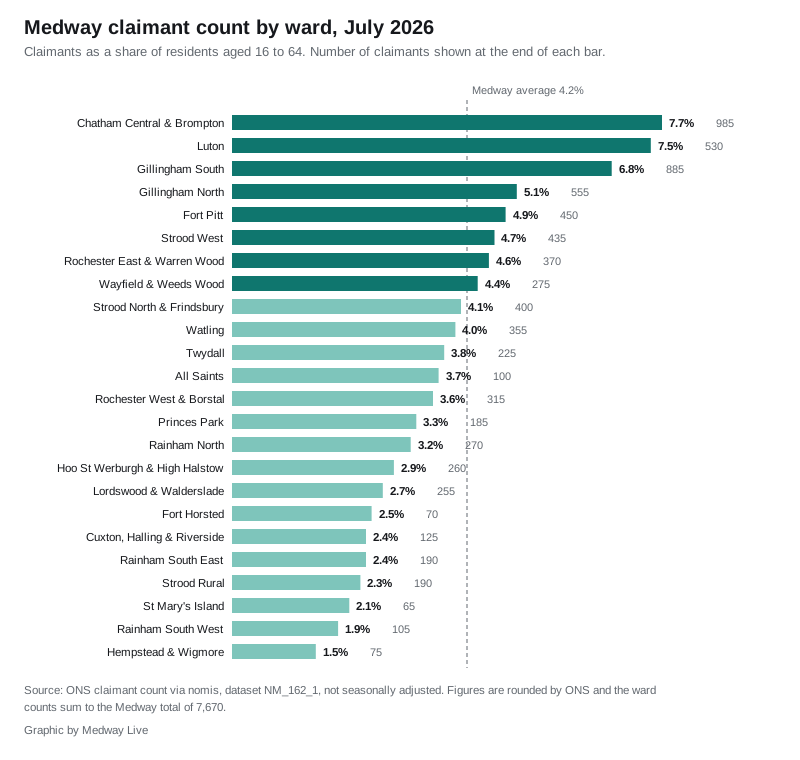
The district figure hides a very wide spread. Across Medway’s 24 wards, the claimant rate runs from 1.5% to 7.7%, a difference of more than five times.
The five highest wards:
- Chatham Central and Brompton, 7.7% (985 claimants)
- Luton, 7.5% (530)
- Gillingham South, 6.8% (885)
- Gillingham North, 5.1% (555)
- Fort Pitt, 4.9% (450)
The five lowest:
- Hempstead and Wigmore, 1.5% (75 claimants)
- Rainham South West, 1.9% (105)
- St Mary’s Island, 2.1% (65)
- Strood Rural, 2.3% (190)
- Rainham South East, 2.4% (190)
Three wards account for a striking share of the total. Chatham Central and Brompton, Gillingham South and Luton hold 2,400 claimants between them, just under a third of everyone on the count across Medway, despite being three wards out of 24.
The geography is not simply town by town. Gillingham South is on 6.8% while Rainham South West, a few miles east, is on 1.9%. Strood West is on 4.7% and Strood Rural on 2.3%. The split runs between neighbourhoods rather than between the Medway towns.
What the claimant count actually counts
This is the number most often reported as if it were unemployment. It is not quite that, and the difference matters when you read it.
The ONS series counts people claiming Jobseeker’s Allowance, plus people claiming Universal Credit who are required to seek work and be available for work. Nomis describes it as the headline indicator of the number of people claiming benefits principally for the reason of being unemployed.
Two consequences follow:
- Some people counted here are in work. Universal Credit claimants on low earnings can still be required to look for more work, and they appear in this figure.
- Some people out of work are not counted, because they are not claiming or are not required to seek work.
ONS also classes the series as experimental, and revises it: June 2026’s figure was revised in this release.
What it means for you
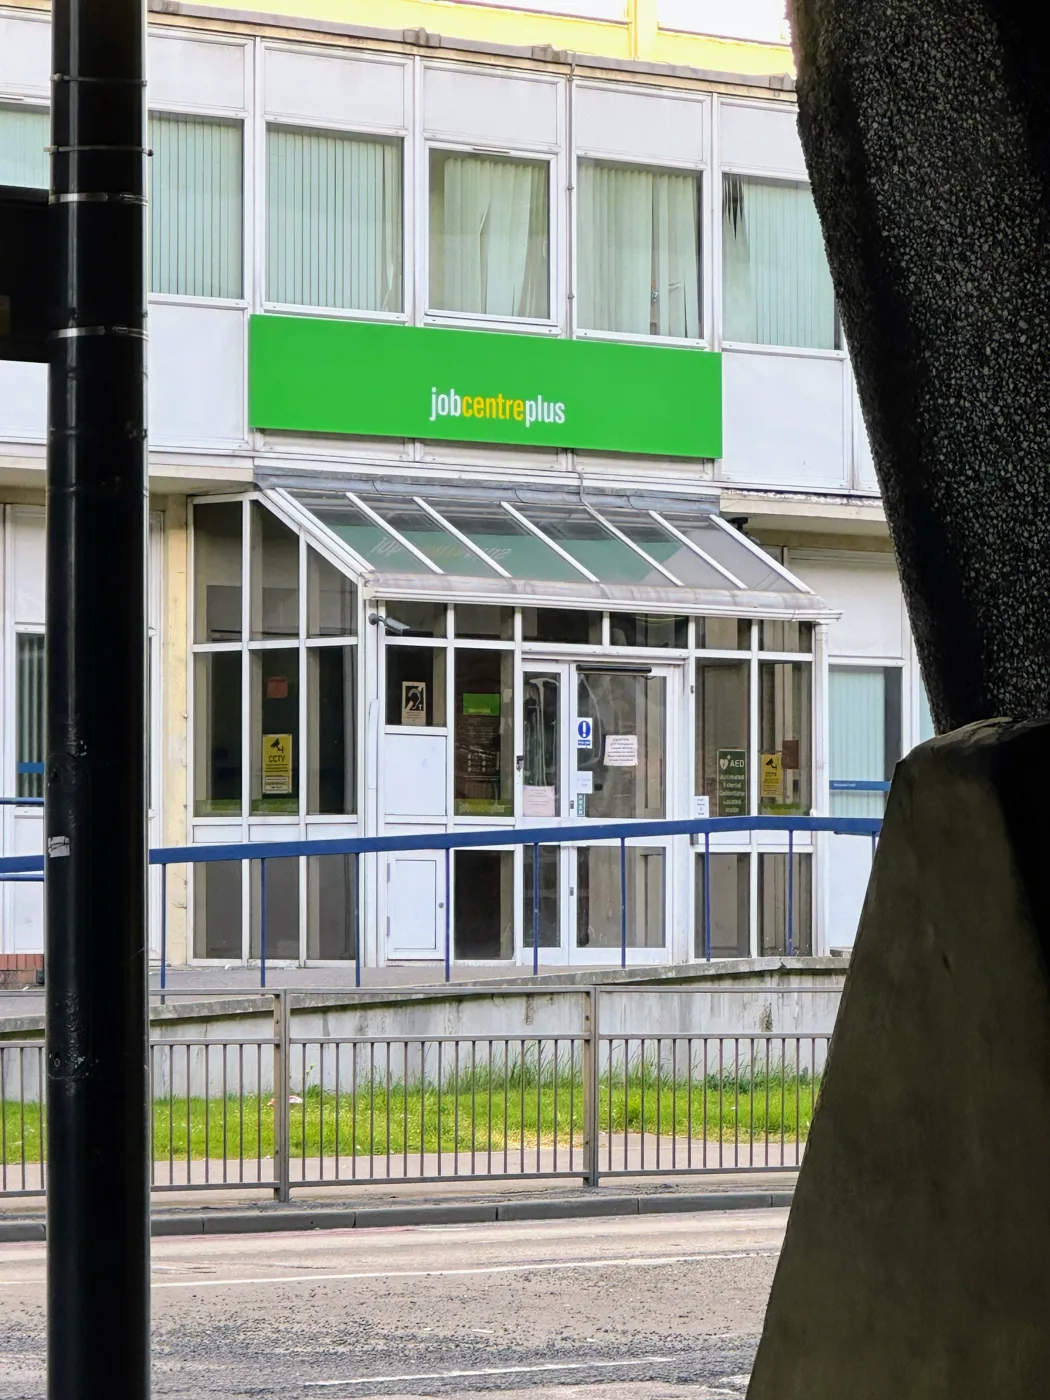
If you are claiming, or think you may need to, the Jobcentre Plus for the Medway towns is at Crown House on The Brook in Chatham, and Universal Credit claims are made through gov.uk. Support with the cost of living, including the household support fund, is handled by Medway Council.
If you are reading this as a resident rather than a claimant, the useful takeaway is about how uneven Medway is. Ward-level figures like these feed into decisions on regeneration funding and council services, so the 7.7% in Chatham Central and the 1.5% in Hempstead are not just statistics; they are the evidence base councils use. You can see how the same divide shows up in property values on our Medway house prices page, and what each band pays on Medway council tax bands.
The next release, covering August 2026, is due on 15 September 2026.
Sources
- ONS claimant count by sex and age, dataset NM_162_1 via nomis, July 2026 data released 18 August 2026
- District figures for Medway, and comparison figures for England, Kent county and the South East, from the same dataset
- Ward figures from the same dataset at ward level (Medway, 24 wards), July 2026
- Definition of the claimant count from nomis
Have your say