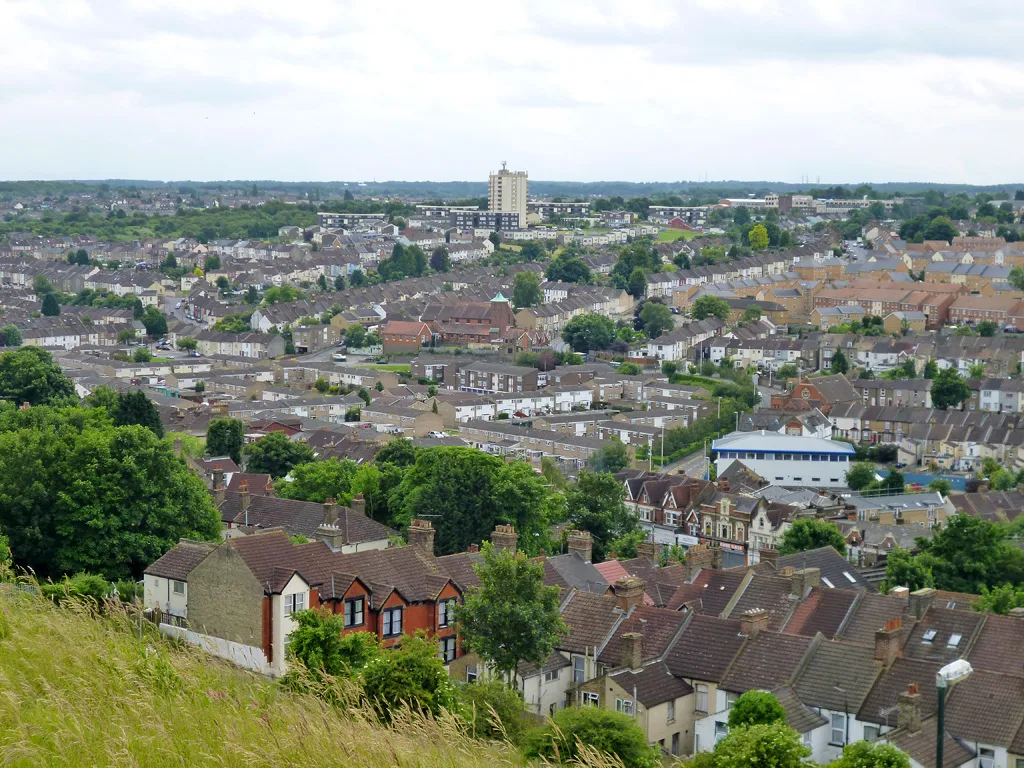

July's Land Registry figures put the average Medway home at £298,547, the biggest monthly rise since March 2025. Flats are the exception, down 2.1% in a year.
The average Medway home sold for £298,547 in July 2026. That is up £2,838, or 1.0%, on June. It is the biggest one-month rise in the Medway market since March 2025.
The figure comes from the UK House Price Index, built by HM Land Registry from completed sales. The July release was published on 16 September 2026.
One point before the numbers. The index is a mean average, not a median. It is also mix-adjusted, so a month with a lot of detached sales does not drag the headline up on its own.
The spring dip is over
Medway prices went backwards for three months this year. The average peaked at £300,704 in March. By June it had fallen to £295,709, a drop of £4,995.
July took £2,838 of that back.
The recovery is not complete. Medway’s all-time high remains £302,237 in January 2023. The July average is still £3,690 short of it, three and a half years later.
Over twelve months the rise is smaller than the monthly figure suggests. July 2025 stood at £295,370, so the annual gain is £3,177, or 1.1%.
Flats are the outlier, and they have gone nowhere in two years
Three of the four property types rose over the year. One did not.
- detached: £535,212, up 0.6%
- semi-detached: £354,042, up 1.8%
- terraced: £276,192, up 1.6%
- flat or maisonette: £168,832, down 2.1%
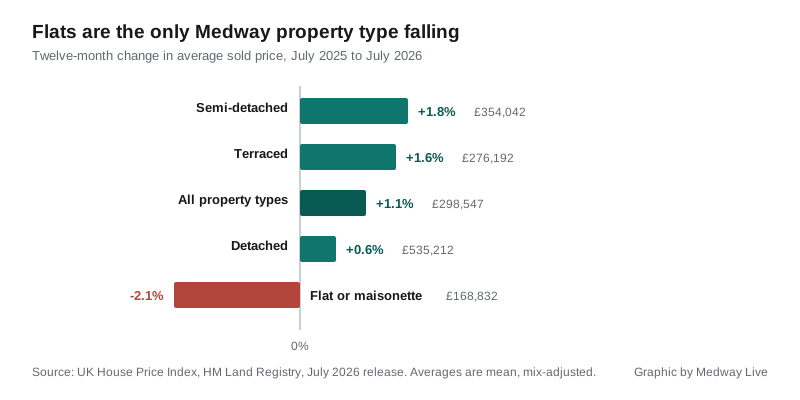
The flat figure is worth sitting with. In July 2024 the average Medway flat was £168,965. Two years on it is £168,832. That is £133 lower in cash terms, before any allowance for inflation.
Against their own January 2023 high of £180,764, flats are down £11,932.
The gap between a flat and a terrace has widened as a result. It was £99,405 in July 2025. It is £107,360 now. Anyone who bought a flat as a first step and planned to trade up to a house has seen that step get taller, not shorter.
The first-time buyer average across all types was £270,791, up 1.3% on the year.
Medway against the rest of Kent
Medway’s 1.1% annual rise puts it eighth of the thirteen Kent local authority areas. Kent as a whole was up 1.5%. England was up 1.1% and the South East up 0.2%.
| Area | Average, July 2026 | 12-month change |
|---|---|---|
| Gravesham | £344,923 | +3.3% |
| Swale | £298,985 | +3.2% |
| Canterbury | £337,454 | +2.9% |
| Dover | £277,750 | +2.7% |
| Thanet | £269,708 | +1.8% |
| Ashford | £347,562 | +1.4% |
| Tonbridge and Malling | £407,880 | +1.4% |
| Medway | £298,547 | +1.1% |
| Sevenoaks | £538,714 | +1.0% |
| Folkestone and Hythe | £303,296 | +0.9% |
| Tunbridge Wells | £456,227 | +0.6% |
| Maidstone | £352,722 | -0.1% |
| Dartford | £347,773 | -2.0% |
Medway is still the third cheapest place to buy in Kent, behind Thanet and Dover. Swale has just gone past it. A year ago the average Swale home was £289,664, below Medway; it is now £438 above.
What it means for you
If you are selling. The July bounce is real but it is one month, and recent months in this index get revised. Do not price off a single reading. The twelve-month picture, 1.1%, is the safer guide.
If you are buying a flat. The market is on your side in a way it is not for houses. Flats have lost value over both one year and two.
If you are buying a house. Semis and terraces are both rising faster than the Medway average, and they are the bulk of what sells here.
If a figure elsewhere looks very different. Portal averages are simple averages of whatever sold, so they run higher. The Land Registry index adjusts for the mix. Check which method a number uses before comparing it to another.
Our fuller breakdown, including how Rochester, Chatham and Gillingham compare, is on the Medway house prices page. If you are working out the running costs of a move, see Medway council tax bands. Recent applications near you are listed on Medway planning applications.
Sources
- UK House Price Index, Medway, July 2026, HM Land Registry
- UK House Price Index for July 2026, published 16 September 2026
Have your say