
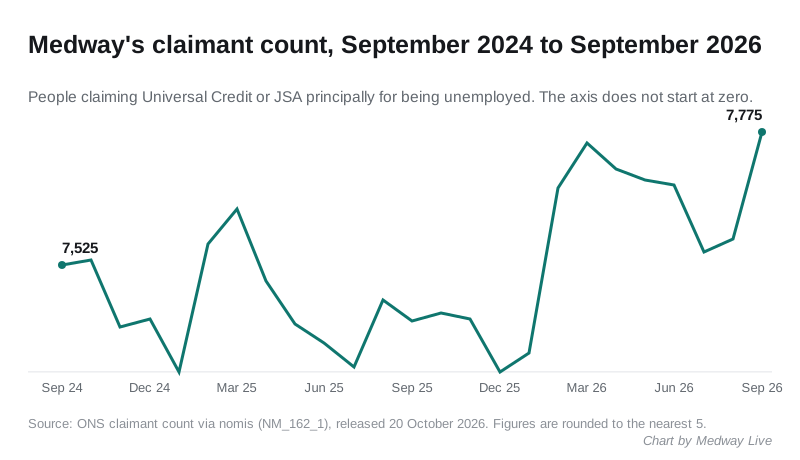
Medway's claimant count rose by 200 to 7,775 in September, its highest since March 2022. Under-25s account for most of the rise, and 17 of 24 wards went up.
Medway’s claimant count rose to 7,775 in September, according to figures the ONS released on 20 October. That is 4.2 per cent of residents aged 16 to 64.
It is the highest monthly count since March 2022, when the total was 7,990 and still falling from its pandemic peak. The rise from August was 200, the largest one-month increase since February.
The count is 355 higher than in September 2025, a rise of 4.8 per cent (nomis, dataset NM_162_1).
Young people are still most of the rise
This month all three age bands went up. Over the year, though, the under-25s did most of the moving:
| Age band | Sept 2025 | Sept 2026 | Change |
|---|---|---|---|
| 16 to 24 | 1,630 | 1,840 | +210 |
| 25 to 49 | 4,290 | 4,365 | +75 |
| 50 and over | 1,500 | 1,565 | +65 |
| All ages | 7,420 | 7,775 | +355 |
The under-25 count is up 12.9 per cent in a year. The band now makes up 23.7 per cent of all Medway claimants.
Over two years the pattern is starker. Since September 2024 the total is up 250, while the under-25 count is up 485. The 25 to 49 group is down 225 over the same period, and the over-50s are down 15.
Where in Medway
The rate rose in 17 of Medway’s 24 wards between August and September. Four were unchanged and three fell slightly: Hoo St Werburgh and High Halstow, Fort Horsted, and Rainham South East, each by 0.1 percentage points.
The highest and lowest wards, as a share of residents aged 16 to 64:
| Highest | Rate | Lowest | Rate |
|---|---|---|---|
| Chatham Central & Brompton | 7.9% | Hempstead & Wigmore | 1.5% |
| Luton | 7.5% | Rainham South West | 1.9% |
| Gillingham South | 7.1% | St Mary’s Island | 2.1% |
| Gillingham North | 4.9% | Rainham South East | 2.3% |
| Fort Pitt | 4.7% | Fort Horsted | 2.5% |
Chatham Central and Brompton now has 1,010 claimants, up from 980 in August. It is the only ward with more than 1,000.
The biggest monthly rise was in Princes Park, from 3.2 to 3.6 per cent. Wayfield and Weeds Wood and Chatham Central and Brompton both rose by 0.3 points.
Ward figures on the current boundaries start in January 2026. Since then, All Saints, Cuxton, Halling and Riverside, and Princes Park are each up 0.6 points. Watling, St Mary’s Island and Gillingham South are each up 0.5.
How Medway compares
At 4.2 per cent, Medway is above the UK rate of 3.9 and England’s 4.1. The South East rate is 3.1.
In Kent, only Thanet at 5.3 per cent and Gravesham at 4.3 are higher. Sevenoaks is lowest at 2.4, followed by Tonbridge and Malling at 2.5.
August’s figure has been cut
When we reported the August count on 19 September, it stood at 7,700. The same series now records August as 7,575, 125 lower.
That is normal for this series. The Universal Credit part of the count can be revised for one previous month, so the newest figure is the one most likely to move. September’s 7,775 may change in November.
What it means for you
- This is not the unemployment rate. The count covers people claiming benefits principally for being unemployed. Under Universal Credit it also includes some people in low-paid work who must look for more. The ONS says it “does not attempt to measure unemployment” (Claimant Count QMI).
- Compare wards by rate, not count. Ward populations differ, so a big ward can have more claimants at a lower rate.
- If you are looking for work, the council’s Employ Medway centre closed in 2019. The Work and Health Programme it points to runs through the Jobcentre, and Medway libraries offer free computer access for job searching (Medway Council).
- The next figures are due on 17 November, covering October (ONS labour market overview). For the other side of the local economy, see our Medway house prices page.
Sources
- ONS claimant count (Universal Credit and Jobseeker’s Allowance), via nomis, dataset NM_162_1, released 20 October 2026 and read on 24 October 2026. Ward figures use Medway wards as of May 2025. Counts are rounded to the nearest 5.
- ONS, Claimant Count Quality and Methodology Information
Have your say