
Medway's claimant count reached 7,700 in August, 4.2% of working-age residents. Every bit of the two-year rise is under-25s, and the 25 to 49 group has shrunk.
Medway’s claimant count rose to 7,700 in August, the ONS reported on 15 September. That is 4.2 per cent of residents aged 16 to 64, and 240 more people than a year ago.
The headline barely moves from month to month. What is underneath it has changed a great deal, and it is a story about young people.
The whole rise is under-25s
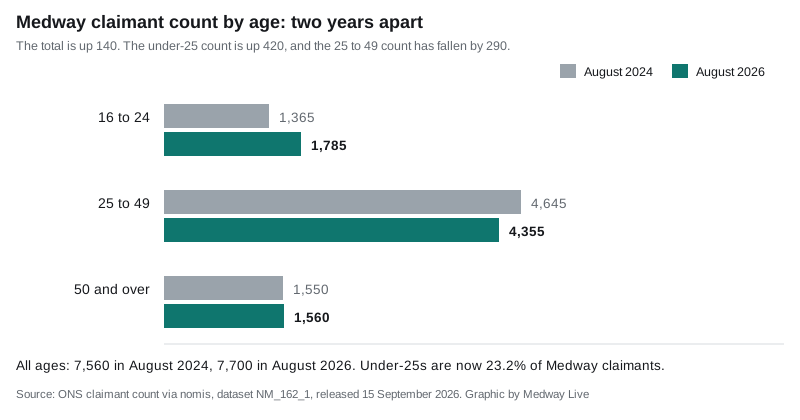
Split the count by age and the totals stop looking flat (nomis, dataset NM_162_1):
| Age band | August 2024 | August 2026 | Change |
|---|---|---|---|
| 16 to 24 | 1,365 | 1,785 | +420 |
| 25 to 49 | 4,645 | 4,355 | -290 |
| 50 and over | 1,550 | 1,560 | +10 |
| All ages | 7,560 | 7,700 | +140 |
Medway’s total is up 140 in two years. The under-25 count is up 420, a rise of nearly 31 per cent, while the largest band, 25 to 49, has fallen by 290. So the increase is not spread across the workforce. It is concentrated at the start of it, and the improvement in the middle is masking most of it.
Young people now make up 23.2 per cent of all Medway claimants, against 18.1 per cent two years ago.
Where in Medway
The rate varies by a factor of five across the 24 wards. These are August 2026 figures, as a share of residents aged 16 to 64:
| Highest | Rate | Lowest | Rate |
|---|---|---|---|
| Chatham Central & Brompton | 7.7% | Hempstead & Wigmore | 1.5% |
| Luton | 7.5% | Rainham South West | 1.9% |
| Gillingham South | 7.0% | St Mary’s Island | 2.0% |
| Gillingham North | 4.9% | Rainham South East | 2.4% |
| Strood West and Fort Pitt | 4.6% | Strood Rural | 2.4% |
Ward figures on the current boundaries only run back to January 2026, so there is no year-on-year comparison yet. Over those eight months, 16 of the 24 wards are up, four are unchanged and four have fallen. The largest moves are All Saints and Watling, both up 0.6 percentage points, and Cuxton, Halling and Riverside and Fort Horsted, both up 0.5. The four that have fallen are Fort Pitt, Rainham South West, Rochester West and Borstal, and Twydall, each by 0.1.
The three highest wards are the ones that did not move much. Chatham Central and Brompton was already at 7.5 per cent in January.
How Medway compares
At 4.2 per cent, Medway is above the UK rate of 3.9 and well above the South East at 3.1. Within Kent, only Gravesham at 4.3 and Thanet at 5.4 are higher. Sevenoaks is lowest at 2.3, with Tonbridge and Malling and Tunbridge Wells at 2.5.
Medway’s gap with the South East has been steady for two years. Its rate sat between 4.0 and 4.2 in every month since August 2024.
Two things to know about this number
It is not the unemployment rate. The claimant count records people claiming benefits principally for being unemployed, taken from the benefits system rather than a survey. Since Universal Credit it also includes people who are in work on low earnings and still required to look for more. The ONS is explicit that the count “does not attempt to measure unemployment, which is a concept defined by the International Labour Organisation” (Claimant Count QMI).
Last month’s figure has already been revised. When we reported the July count on 19 August, it stood at 7,670. The same series now records July as 7,550, a cut of 120. That is not an error in either figure. The Universal Credit part of the count allows revisions to one previous month, so the newest month published is always the one most likely to move.
What it means for you
- If you are looking for work in Medway, the council no longer runs an advice centre. Its Employ Medway centre closed on 18 December 2019, and the Work and Health Programme it points to is delivered by the Shaw Trust on referral from the Jobcentre. The council lists free computer access at Medway libraries for job searching (Medway Council).
- If you are comparing wards, use the rate rather than the count. Ward populations differ, and a big ward can have more claimants at a lower rate.
- The next figures are due on 20 October, covering September. August’s 7,700 may be revised at the same time.
- Claimant numbers are one of the few current local indicators we have. They are published within weeks of the month they cover, where the census is five years old and house price data runs two months behind. Our Medway house prices page has the other side of the local picture.
Sources
- ONS claimant count (Universal Credit and Jobseeker’s Allowance), via nomis, dataset NM_162_1, released 15 September 2026 and read on 19 September 2026
- ONS, Claimant Count Quality and Methodology Information
- Ward figures: same dataset, Medway wards as of May 2025
Have your say